Introduction
Being a student in today’s world presents unique challenges and opportunities. Whether you’re a parent trying to understand your child’s educational journey, an educator seeking to better support your students, or a student yourself navigating the complex landscape of modern education, understanding the key aspects of student life, learning, and development is essential.
Students today face a rapidly evolving educational environment shaped by technological advancements, changing workforce demands, economic pressures, and shifting social dynamics. From elementary school to higher education, students must adapt to new learning modalities, manage increasing academic expectations, and prepare for futures that may look very different from those of previous generations.
This comprehensive guide addresses the most frequently asked questions about students across all educational levels. Drawing on current research and expert insights, we’ll explore everything from learning strategies and mental health considerations to financial challenges and technological impacts, providing a thorough understanding of what it means to be a student in 2025.
Learning and Academic Success
What factors contribute to student academic success?
Academic success is influenced by multiple interconnected factors:
- Metacognitive awareness: A student’s ability to understand and regulate their own learning processes, including college entrance examination scores, satisfaction levels, and self-achievement.
- Learning motivation: Internal drive and interest in the subject matter. Research shows that academic self-efficacy positively impacts students’ willingness to engage and communicate in classroom settings.
- Learning engagement: The extent to which students actively participate in classroom activities, extracurricular learning, and group discussions. Higher engagement levels typically correlate with better academic performance.
- Environmental factors: The quality of learning spaces, access to resources, and the campus atmosphere all impact learning outcomes. Schools with accurate and sufficient experimental equipment enable students to better understand principles and achieve better results in experiment reports and related assessments.
- Time management: A student’s ability to allocate their time effectively across academic, personal, and social commitments.
- Mental health: Emotional and psychological well-being directly affects concentration, motivation, and academic performance.
- School social atmosphere: Teacher-student relationships and peer interactions play a crucial role. A positive and supportive group atmosphere helps with knowledge sharing and collective progress.
What are effective study strategies for students?
Research indicates several evidence-based study methods that enhance learning:
- SMART goal setting: Creating specific, measurable, attainable, relevant, and timely objectives for each semester helps students keep academic priorities in check. For example, setting aside at least one hour daily for reading assigned materials.
- Active engagement: Simply reading or highlighting material is less effective than actively interacting with it through self-questioning, summarizing, or teaching concepts to others.
- Spaced repetition: Distributing study sessions over time rather than cramming improves long-term retention and understanding.
- Regular self-testing: Using practice tests or flashcards to recall information strengthens memory and helps identify knowledge gaps.
- Varied practice: Mixing different types of problems or topics within a study session improves the ability to distinguish between concepts and apply them appropriately.
- Making connections: Relating new information to existing knowledge creates stronger neural pathways and deeper understanding.
- Teaching others: Explaining concepts to peers reinforces learning and reveals areas needing further study.
- Building effective connections: Actively engaging with instructors and peers through thorough responses to discussion topics, sharing personal insights, and contributing to group projects enhances learning outcomes.
How do different learning styles affect education?
The concept of distinct learning styles (visual, auditory, kinesthetic) has been widely discussed in education, but recent research suggests a more nuanced approach:
- Multimodal learning: Most effective learning involves multiple sensory inputs rather than relying on a single preferred style. Students benefit from diverse presentation methods regardless of their self-identified learning preference.
- Content-appropriate methods: Different subjects and skills may require different approaches. For example, language learning benefits from auditory practice, while spatial concepts may be better understood through visual representations.
- Individual differences: While rigid learning style categories may be oversimplified, students do differ in their learning preferences, strengths, and challenges. Recognizing these individual differences while providing varied instructional approaches benefits all students.
- Universal Design for Learning: This framework promotes providing multiple means of engagement, representation, and expression to accommodate all learners, rather than tailoring instruction to specific learning styles.
- Personalized learning approaches: Technology now enables more individualized learning paths based on student needs, interests, and pace, allowing for adaptations that go beyond simplistic learning style categories.
How can struggling students improve their academic performance?
Students facing academic challenges can benefit from these evidence-based strategies:
- Identify specific challenges: Pinpointing particular subjects, skills, or concepts that present difficulties allows for targeted intervention.
- Seek appropriate help: Utilizing academic support services such as tutoring, writing centers, or supplemental instruction provides expert guidance tailored to specific needs.
- Develop organizational systems: Creating structured plans for assignments, study time, and deadlines reduces cognitive load and ensures adequate time for challenging material.
- Build foundational skills: Academic struggles often stem from gaps in prerequisite knowledge or skills. Strengthening these foundations often improves performance in more advanced coursework.
- Adopt a growth mindset: Viewing intelligence and ability as qualities that can be developed through effort rather than fixed traits increases resilience and motivation when facing challenges.
- Improve time management: Breaking large tasks into smaller components with regular milestones prevents last-minute cramming and allows time for questions and revisions.
- Reduce distractions: Creating a dedicated study environment and using tools to manage technology distractions improves focus and learning efficiency.
- Address underlying issues: Sometimes academic struggles stem from non-academic factors such as health problems, stress, or personal challenges that require appropriate support.
Student Mental Health and Well-being
How prevalent are mental health issues among students?
Mental health challenges are increasingly common among today’s students:
- Widespread impact: Almost 90% of students report that their mental health disrupts their ability to study or complete assignments at least occasionally, with one in ten experiencing these disruptions daily.
- Negative emotional experiences: More students report experiencing negative emotions while studying, such as anxiety (41%), boredom (39%), and frustration (37%), than positive ones like confidence (34%) and satisfaction (33%).
- Primary causes: Students attribute their difficulties primarily to time management and procrastination (47%), distractions from technology and other people (38%), feeling like they don’t have enough time (34%), and lack of interest in the material (33%).
- Generational perspectives: College presidents and students differ in their assessment of what’s driving the mental health crisis. While 86% of college presidents believe social media is very or extremely influential, only 33% of students share this view. Students are more likely to cite academic stress (37%) and balancing personal, economic, and family duties with schoolwork (42%).
- Academic impact: Mental health challenges can significantly impact academic performance, with severe mental health problems potentially leading to plummeting grades or dropping out.
What strategies help students maintain good mental health?
Effective approaches to supporting student mental health include:
- Create balance: Implementing healthy work-life balance practices is crucial in preventing burnout. This includes reducing screen time, setting clear boundaries, and making time for social activities and self-care.
- Establish routine: Creating consistent schedules for sleep, studying, exercise, and relaxation provides structure and predictability that reduces stress.
- Build connections: Meaningful social relationships serve as valuable support systems. Saying “yes” to quality time with friends and communicating interest in spending time with others nurtures emotional well-being.
- Practice mindfulness: Techniques such as deep breathing, guided meditation, mindful walking, and progressive muscle relaxation can help manage stress and improve focus.
- Exercise regularly: Physical activity boosts memory, learning, and focus, leading to better academic performance. It also strengthens physical health and increases energy levels.
- Seek help when needed: Recognizing when stress becomes overwhelming and reaching out to friends, professors, or counseling services is essential for preventing more serious issues.
- Maintain a positive outlook: While students can’t always control situations, they can choose how to react. Embracing a positive attitude and focusing on the good in oneself and one’s surroundings supports emotional well-being.
How does technology affect student mental health?
Technology has complex effects on student mental well-being:
- Divided perspectives: Social media’s impact on mental health is viewed differently by different groups. While 86% of college presidents believe social media significantly influences student mental health, only 33% of students share this perspective.
- Dual nature: Digital tools can both support and harm mental health. Social media and technology can connect students with support networks and resources but may also contribute to distraction, comparison, and isolation.
- Screen time management: Controlling and monitoring screen usage through app features can enhance work productivity and physical well-being by reducing eye strain and improving sleep quality.
- Digital distractions: Technology distractions rank among the top challenges cited by students (38%) as disrupting their ability to study effectively.
- Post-pandemic challenges: Following COVID-19, schools report significant increases in disruptive behavior, lack of attentiveness, and social-emotional challenges, with 26% of public school leaders reporting a “severe negative impact” on learning due to students’ lack of focus.
- Technology management: Balancing beneficial technology use with managing distractions, particularly cell phone and social media addiction which intensified during remote learning periods, remains a significant challenge.
How can students balance academics with other responsibilities?
Achieving balance across multiple demands requires strategic approaches:
- Assess work needs realistically: School administrators recommend students ideally work 10-15 hours per week to leave adequate time for class, assignments, and building relationships. For students with greater financial responsibilities, options include choosing online classes for flexibility, working with advisors to schedule strategically, and applying for grants and scholarships.
- Create boundaries: Learning to say no to new commitments and blocking specific time for self-care helps maintain balance and prevents overextension.
- Use technology strategically: Tools for time management, organization, and distraction blocking can help students maximize productive time.
- Build support systems: Connecting with others who understand the challenges of balancing multiple responsibilities provides both emotional support and practical assistance.
- Prioritize self-care: Making basic needs like adequate sleep, nutrition, and exercise non-negotiable priorities prevents burnout and improves overall functioning.
- Apply time management techniques: Breaking large tasks into smaller components, using calendar systems to track deadlines, and scheduling work during periods of peak energy and focus improves efficiency.
- Communicate with instructors: When balancing becomes particularly challenging due to work, family, or health issues, proactive communication with instructors about potential accommodations can prevent academic problems.
Financial Aspects of Being a Student
How much does higher education typically cost?
The cost of higher education varies significantly based on several factors:
- Public vs. private institutions: Public institutions typically have lower tuition rates, especially for in-state students, compared to private colleges and universities.
- Institution type: Community colleges generally cost less than four-year institutions, with selective private universities typically having the highest sticker prices.
- Geographic location: Both tuition rates and living expenses vary by region, with urban areas generally having higher costs than rural locations.
- Program of study: Some majors and professional programs (such as engineering, business, or medicine) may have higher tuition rates or additional fees compared to other fields of study.
- Additional expenses: Beyond tuition, students must budget for books, supplies, housing, food, transportation, health insurance, and personal expenses, which can equal or exceed tuition costs.
These rising costs have contributed to the growth in student loan debt, which has increased by approximately 52% since 2013, with federal student loan debt now exceeding $1.7 trillion nationwide.
How prevalent is student loan debt?
Student loan debt has become a common reality for many students and graduates:
- Age distribution: One-in-four U.S. adults under 40 have student loan debt. This percentage drops to 14% among those ages 40-49 and to just 4% among those 50 and older.
- Education level correlation: The likelihood of having student loans increases with education level. Among adults under 40 with at least a four-year college degree, 36% have outstanding student loan debt.
- Debt amounts: The median borrower with outstanding student debt owed between $20,000 and $24,999 in 2023. This varies by education level: those with some college but no bachelor’s degree typically owed between $10,000 and $14,999, bachelor’s degree holders owed between $20,000 and $24,999, and those with postgraduate degrees owed between $40,000 and $49,999.
- Institution type impact: Among those who attended public institutions, 40% either previously held debt or currently had debt as of October 2023, compared with 57% of those who attended private not-for-profit schools and 63% who attended private for-profit institutions.
- Geographic variations: The average student debt per borrower varies significantly by state, from lows of around $30,000 in states like North Dakota, Alaska, and Wyoming to highs of over $40,000 in Maryland, West Virginia, and Florida. Washington, D.C. has the highest average at $54,146.
How can students manage education costs and minimize debt?
Students can employ various strategies to reduce the financial burden of education:
- Explore grant and scholarship opportunities: Unlike loans, these do not require repayment. Sources include federal and state governments, educational institutions, employers, community organizations, and private foundations.
- Consider starting at community college: Completing general education requirements at a lower-cost community college before transferring to a four-year institution can significantly reduce overall expenses.
- Compare financial aid packages carefully: Looking beyond the sticker price to the actual cost after financial aid is crucial for making informed decisions about which institution provides the best value.
- Work part-time strategically: While excessive work hours can interfere with academic success, working 10-15 hours per week can provide valuable experience and income without significantly impacting studies.
- Take advantage of tax benefits: Education tax credits like the American Opportunity Tax Credit and Lifetime Learning Credit can reduce tax liability for eligible students or their families.
- Graduate on time: Each additional semester increases costs through both direct expenses and delayed entry into the full-time workforce. Careful planning and regular academic advising can help students avoid unnecessary delays.
- Borrow wisely: If loans are necessary, federal student loans generally offer better terms and more flexible repayment options than private loans. Students should borrow only what is necessary for educational expenses.
What financial aid options are available to students?
Students can access various forms of financial assistance:
- Need-based federal grants: Programs like the Pell Grant provide funds based on financial need that do not require repayment.
- Federal student loans: These offer fixed interest rates, income-driven repayment options, and potential forgiveness programs. They include Direct Subsidized Loans (no interest while in school) and Direct Unsubsidized Loans for undergraduate and graduate students.
- Work-study programs: Federally subsidized part-time employment opportunities allow students to earn money for education expenses while gaining work experience, often in positions related to their field of study or community service.
- Institutional scholarships: Many colleges and universities offer merit-based scholarships for academic achievement, leadership, artistic talent, athletic ability, or other qualities, regardless of financial need.
- Private scholarships: Numerous organizations, foundations, corporations, and community groups offer scholarships based on various criteria, including field of study, demographic characteristics, or specific talents and interests.
- Loan forgiveness programs: Programs such as Public Service Loan Forgiveness, Teacher Loan Forgiveness, and Perkins Loan Cancellation can forgive significant portions of federal student loans for graduates working in qualifying fields or settings.
- State-specific programs: Many states offer additional loan forgiveness or scholarship programs for students, particularly for those pursuing high-need fields.
Technology and Education
How is technology changing the educational experience?
Technology is fundamentally transforming how students learn and interact with educational content:
- Shift in teacher roles: Educators are increasingly becoming guides who help students navigate, evaluate, and synthesize information rather than being the primary source of knowledge.
- Personalized learning: Technology enables more individualized learning paths based on student needs, interests, and pace, with adaptive platforms using algorithms to customize content and pacing.
- Blended and hybrid models: Combinations of in-person and online learning are becoming more common, offering flexibility and expanded learning opportunities.
- Data-informed instruction: Educators increasingly use sophisticated assessment data to target instruction and interventions, with advanced learning analytics helping teachers identify patterns and intervene early with struggling students.
- Global connectivity: Classrooms are connecting internationally, exposing students to diverse perspectives and collaborative opportunities across borders.
- Emphasis on future-ready skills: Greater focus is being placed on creativity, critical thinking, collaboration, and adaptability rather than solely content knowledge.
- Interdisciplinary approaches: Traditional subject silos are breaking down in favor of integrated learning experiences that reflect real-world problem-solving.
What digital tools are most effective for student learning?
Several types of educational technology have demonstrated positive impacts on learning:
- Interactive digital tools: Smart whiteboards, digital textbooks, and interactive software create engaging and dynamic learning environments.
- Learning Management Systems (LMS): Platforms like Canvas, Google Classroom, and Schoology provide comprehensive digital environments for content delivery, assessment, feedback, and communication.
- Artificial intelligence applications: Tools help teachers create lesson plans, generate content, reduce paperwork, provide student feedback, and develop assessments. AI also enhances personalized learning through adaptive platforms and intelligent tutoring systems.
- Virtual and augmented reality: Immersive experiences bring abstract concepts to life and allow students to explore environments otherwise inaccessible.
- Student response systems: Applications like Mentimeter, Kahoot!, and Pear Deck transform passive lessons into interactive experiences providing real-time feedback.
- Content creation tools: Software empowers students to create rather than just consume content, shifting them from passive to active learning.
- Adaptive learning platforms: Programs adjust to individual student progress and provide personalized learning paths based on demonstrated mastery.
How is artificial intelligence impacting student learning?
AI is revolutionizing numerous aspects of education:
- Personalized learning: AI systems analyze student performance data to create customized learning pathways that adapt to individual strengths, weaknesses, and learning styles.
- Automated assessment: AI tools can evaluate certain types of student work (especially objective assessments), providing immediate feedback and freeing instructor time for more complex teaching tasks.
- Intelligent tutoring: AI-driven tutors offer customized guidance through individualized instruction and feedback, adjusting explanations and practice based on student responses.
- Content generation: AI systems can create instructional materials, practice questions, and explanations tailored to specific learning objectives and student needs.
- Academic performance prediction: Machine learning techniques play a significant role in predicting student outcomes, which helps identify at-risk students and implement timely interventions.
- Administrative efficiency: AI systems streamline administrative tasks like scheduling, enrollment management, and resource allocation, allowing educational institutions to focus more resources on teaching and learning.
- Accessibility enhancements: AI-powered tools provide real-time captioning, text-to-speech, speech-to-text, and translation services that make educational content more accessible to diverse learners.
How can students effectively use technology for learning while avoiding digital distractions?
Balancing beneficial technology use with potential distractions requires intentional strategies:
- Use technology management tools: Apps and browser extensions that block distracting websites or limit time on social media can help maintain focus during study sessions.
- Create technology-free zones and times: Designating certain spaces and periods as device-free helps establish boundaries and reduce dependency on constant connectivity.
- Practice digital mindfulness: Being aware of one’s technology usage patterns helps identify problematic behaviors and develop healthier habits.
- Schedule specific tech time: Allocating dedicated time for social media and entertainment creates natural boundaries during study periods.
- Use the Pomodoro Technique: Working in focused intervals (typically 25 minutes) followed by short breaks can increase productivity and provide structured time for technology use during breaks.
- Utilize offline modes: Many educational applications and resources can be downloaded for offline use, eliminating the temptation to switch to distracting online content.
- Leverage focus-enhancing technology: Some digital tools are specifically designed to improve concentration through features like white noise, focused writing environments, or gamified focus sessions.
Diversity and Inclusion in Education
How diverse is the student population in educational institutions?
Student diversity continues to evolve across educational settings:
- Racial and ethnic diversity: The student population is becoming increasingly diverse, though representation varies significantly by institution type and geographic location.
- Socioeconomic diversity: Students come from increasingly varied economic backgrounds, though access to certain types of institutions still correlates strongly with family income.
- First-generation students: Many students are the first in their families to attend college, bringing unique perspectives and often facing distinct challenges in navigating educational systems.
- International student population: Global mobility for education creates increasingly diverse campus communities, though recent years have seen fluctuations in international enrollment due to policy changes and global events.
- Age diversity: The traditional image of students has expanded to include more adult learners returning to education at various life stages.
- Gender representation: Gender ratios have shifted in higher education, with women now comprising the majority of college students overall, though representation varies significantly by field of study.
- Disability representation: Improved accessibility and accommodations have expanded educational opportunities for students with various disabilities, though barriers to full inclusion persist.
What challenges do diverse student populations face?
Students from diverse backgrounds encounter various obstacles:
- Access barriers: Socioeconomic factors can limit access to educational resources, technology, enrichment opportunities, and high-quality schools.
- Belonging concerns: Students from underrepresented groups may experience challenges feeling fully included in educational communities that haven’t historically been designed with their needs in mind.
- Representation gaps: Lack of diversity among faculty, administration, and in curricular materials can impact student engagement and sense of possibility.
- Cultural adaptation: International students face unique challenges in adapting to new cultural environments, educational expectations, and social norms while studying abroad.
- Stereotype threat: Awareness of negative stereotypes about one’s group can create psychological pressure that interferes with academic performance.
- Financial pressures: Students from lower-income backgrounds often face greater pressure to work while studying and may have fewer family resources to draw on during financial emergencies.
- Linguistic challenges: Students for whom the language of instruction is not their first language may face additional hurdles in demonstrating their knowledge and participating fully in academic discourse.
How can educational institutions better support diverse student populations?
Effective support for diverse students includes:
- Cultural competence training: Providing educators with skills to effectively teach and support students from diverse backgrounds improves educational experiences for all students.
- Inclusive curriculum design: Materials that reflect diverse perspectives, experiences, and contributions help all students feel represented and valued.
- Targeted support programs: Initiatives specifically designed to address the unique challenges faced by particular student populations can provide necessary resources and community.
- Financial assistance: Expanding need-based aid, emergency grants, and programs addressing food and housing insecurity helps reduce financial barriers to success.
- Mentorship opportunities: Connecting students with mentors who share aspects of their identity can provide valuable guidance and role models.
- Accessible learning environments: Universal design approaches benefit all students, particularly those with disabilities, by creating multiple pathways to engage with material.
- Cultural adaptation support: For international students, providing resources to navigate culture shock, which typically follows predictable phases (honeymoon, crisis, adjustment, acceptance), helps them successfully transition to new educational environments.
How does cultural background influence the educational experience?
Cultural factors shape how students engage with education in multiple ways:
- Learning style preferences: Cultural background may influence preferred approaches to learning, communication styles, and comfort with different types of classroom activities and assessment methods.
- Value systems and motivations: Cultural values regarding education, achievement, and career paths can impact student goals, motivation, and educational decision-making.
- Communication patterns: Differences in direct versus indirect communication, comfort with asking questions, and norms around participation can affect classroom engagement.
- Cultural adaptation process: International students typically experience several phases of cultural adjustment, including the honeymoon phase (initial excitement), crisis phase (feeling overwhelmed), adjustment phase (developing coping strategies), and acceptance phase (feeling at ease in the host culture).
- Identity development: Educational settings often play a significant role in how students explore and develop their cultural identities, especially during adolescence and young adulthood.
- Family relationships: Cultural norms regarding family roles, obligations, and decision-making influence students’ educational choices and experiences.
- Cultural capital: Students vary in their familiarity with the unwritten rules and expectations of educational institutions based on their cultural background and previous exposures.
Student Development and Future Preparation
How does education prepare students for future careers?
Education contributes to career readiness in several ways:
- Subject-specific knowledge: Students develop expertise in particular fields that serves as a foundation for specialized careers.
- Transferable skills: Skills like critical thinking, communication, problem-solving, and teamwork apply across diverse career paths and changing workplace demands.
- Digital literacy: Experience with various technologies prepares students for increasingly digital workplaces and the ability to adapt to new tools as they emerge.
- Professional networks: Educational institutions provide opportunities to build relationships with peers, faculty, and industry professionals that can lead to career opportunities.
- Career exploration: Education offers chances to explore various fields through coursework, internships, research, and extracurricular activities before committing to specific career paths.
- Credential signaling: Degrees and certificates signal to employers that students have demonstrated certain capabilities and completed structured learning experiences.
- Professional identity formation: Educational experiences help students develop their sense of who they are professionally and the values and approaches they bring to their work.
What skills are most important for students to develop for future success?
Several key competencies prepare students for evolving future demands:
- Critical thinking and problem-solving: The ability to analyze information, evaluate evidence, and develop creative solutions is consistently valued across fields.
- Communication: Strong written, verbal, and digital communication skills enable effective collaboration and idea-sharing in increasingly connected workplaces.
- Digital literacy and technological fluency: Comfort with various digital tools and the ability to adapt to new technologies are essential in nearly all modern career paths.
- Data literacy: The capacity to analyze and apply data to inform decisions is increasingly important across diverse fields.
- Adaptability and continuous learning: The rapid pace of change requires the ability to acquire new knowledge and skills throughout one’s career.
- Collaboration and intercultural competence: Working effectively with diverse teams is essential in global and multicultural workplaces.
- Self-management: Skills like time management, organization, goal-setting, and self-reflection support success in increasingly autonomous work environments.
- Entrepreneurial thinking: The ability to identify opportunities, take initiative, and develop innovative solutions is valued even within established organizations.
How can students best prepare for changing workforce demands?
Preparing for an evolving job market requires strategic approaches:
- Develop versatile skill sets: Combining specialized knowledge with transferable skills creates flexibility to pivot as workplace needs change.
- Engage in experiential learning: Internships, cooperative education, project-based learning, and service learning provide practical experience and build professional networks.
- Pursue continuous learning: Developing the habit of ongoing education through formal and informal channels prepares students for careers requiring constant adaptation.
- Build digital portfolios: Documenting projects, skills, and accomplishments provides evidence of capabilities beyond traditional credentials.
- Cultivate professional networks: Relationships with mentors, industry professionals, and peers create valuable connections for career development and opportunities.
- Seek interdisciplinary experiences: Exposure to multiple fields and approaches builds the ability to connect ideas across domains and find innovative solutions.
- Develop a growth mindset: Viewing challenges and failures as opportunities for learning rather than fixed limitations supports resilience in changing environments.
How does extracurricular involvement benefit student development?
Participation in activities outside the classroom contributes to development in multiple ways:
- Skill development: Extracurricular activities provide opportunities to develop leadership, teamwork, time management, and specific technical skills relevant to the activity.
- Identity exploration: Trying different activities helps students discover interests, values, and strengths that inform academic and career choices.
- Community building: Involvement creates connections with peers who share interests, building support networks and enhancing sense of belonging.
- Practical application: Many activities allow students to apply classroom learning in real-world contexts, deepening understanding and building confidence.
- Resume enhancement: Meaningful involvement demonstrates initiative, commitment, and specific skills to future employers or graduate programs.
- Stress management: Engaging in enjoyable activities provides balance and stress relief that supports overall well-being and academic success.
- Cultural and social capital: Participation exposes students to new experiences, perspectives, and connections that may not be available through academic coursework alone.
Conclusion
Understanding the multifaceted aspects of student life is essential for supporting educational success and well-being in today’s complex world. Students face unprecedented challenges—from navigating rapidly evolving technologies and managing mounting financial pressures to addressing mental health concerns and preparing for uncertain future careers—all while striving to meet increasing academic expectations.
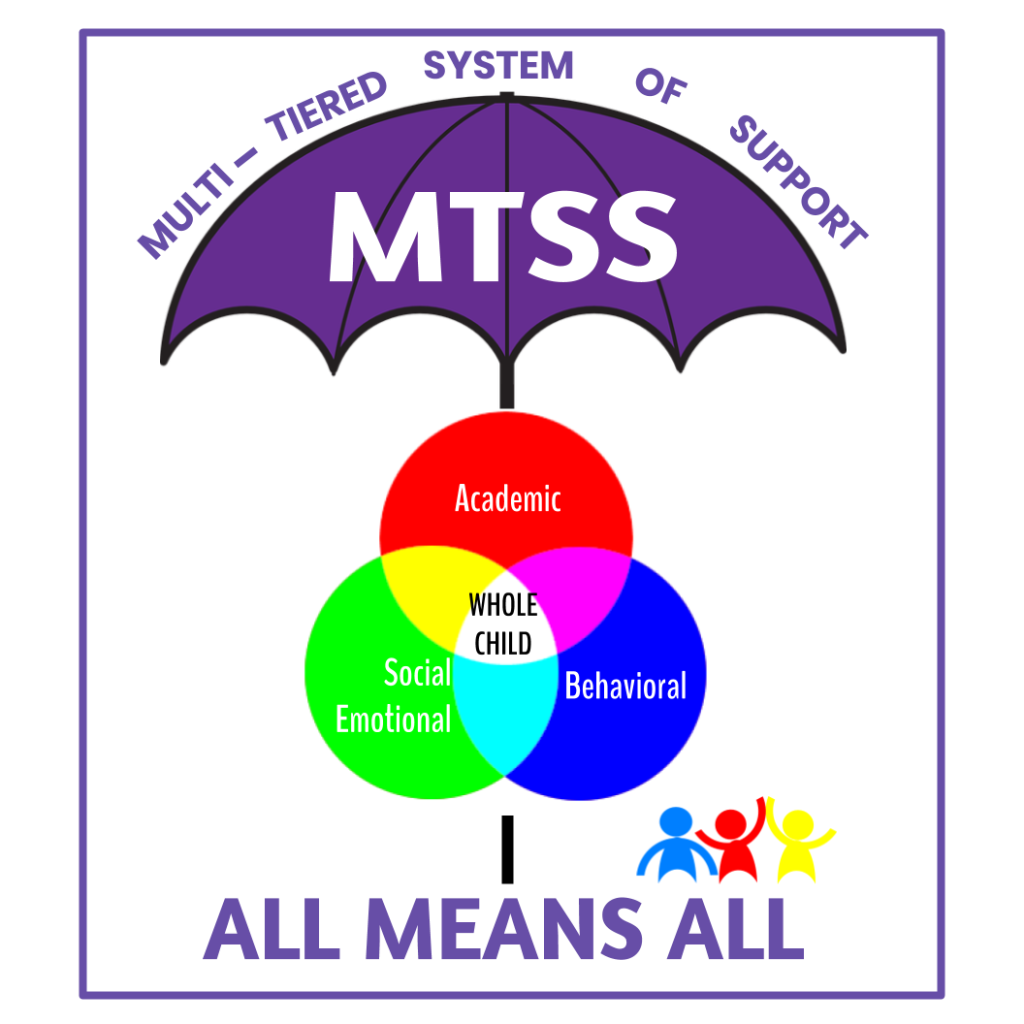
The questions explored in this comprehensive guide reveal that effective student support requires balanced attention to academic, social, emotional, financial, and future-oriented dimensions of development. Approaches that recognize students as whole individuals with diverse needs, backgrounds, and aspirations will best foster their growth and success.
As educational environments continue to evolve, ongoing dialogue among students, parents, educators, and policymakers remains crucial. By working together to address the questions and challenges highlighted here, we can create learning experiences that not only impart knowledge but also build the resilience, skills, and perspectives students need to thrive in an increasingly complex and interconnected world.
Whether you’re a student seeking strategies for success, a parent trying to provide effective support, or an educator working to create optimal learning environments, we hope this guide offers valuable insights and practical approaches to enhance the educational journey.