
What are the mean, median, mode, midrange, and range?
The mean, mode, median, and range are averages used in statistics to give information about data and help the user to conclusions.
The mean, mode, median, midrange, and range are defined as:
- Mean: the average can be calculated by adding all the values in a data set and dividing it by the overall number of values you added together.
- Median: the middle number in the set of values. You find it by putting the numbers in order from the smallest to largest and covering up one number on each end until you reach the middle.
- Mode: the number or value that appears most often in the set. To find the mode, you must count how many times each value appears.
- Range: the difference between the lowest and the highest value. Subtract the lowest possible value from the highest to work it out.
- Midrange: the number exactly halfway between the minimum and maximum numbers in a data set. To work out the midrange, you must find the sum of the smallest and largest and divide it by 2.
Children will learn about these averages in maths lessons on statistics, which will provide them with essential skills, such as analyzing data, understanding trends, and more.
How do I calculate the mode, median, mean, midrange, and range?
How to calculate mean:
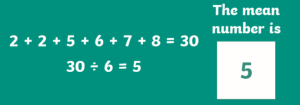
We can work out how to calculate mean numbers using the set of data below:
2, 2, 5, 6, 7, 8
To work out the mean, you should:
- Add all the numbers to the data set to find the total.
- Divide the total by the number of individual values in the data set.
In the example (see below), adding these values results in 30, divided by 6 (the number of values) equals 5. This means that we’ve found the mean to be 5.
How to calculate the median:
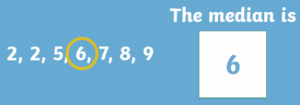
We can work out how to calculate the median using the set of data below:
2, 5, 7, 2, 6, 8, 9
To calculate the median, you need to:
- Arrange the numbers in order, starting from the smallest and ending with the largest.
- Start covering up one number on each end until you get to the middle one.
In the example below, you’ll see that the median is six, as this is the number that appears in the middle of the data set.
Below are a few challenging questions for your children to practice calculating the median:
- A shoe shop has recently had an end-of-season sale. They’ve sold trainers in sizes 6, 7, 4, 7, 7, 6, 4, 6, and 5. What was the middle shoe size?
- What is the median of these numbers: 4.1, 4.5, 2.0, 4.6, and 4.2?
- The cost of 5 different fruit juices is 75p, 99p, 89p, 79p, and 85p. What’s the median price?
How to calculate the mode:
The mode helps to find the most frequent number.
Let’s take 2, 2, 5, 6, 7, and 8 as the set of values to see how the mode can be worked out.
If you count how many times each number is present in the set, you’ll notice that 2 appears the most. This means that 2 is the mode — it’s as easy as that!

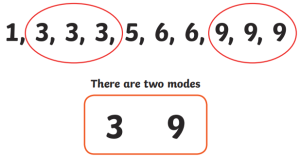
It’s important to remember that you can have more than one mode, so don’t worry if there are two or more sets of numbers, which appear equal times and are the highest values.
Why not encourage children to solve the problems below to track children’s knowledge?
- What is the mode of these numbers: 54, 67, 32, 54, 72, 98, 32, 33, 21, 32, 67?
- Julieta had 6 maths tests, the scores of which were: 82, 75, 78, 82, 71, and 82. What was her mode score?
- Throughout the week, Annie went to the shop 7 times. On her visits, she spent: £5, £7, £9, £5, £2, £5, and £6. What was the most common amount of money Annie spent?
How to calculate the midrange:
The midrange is used to identify a measure of the center.
There are a few simple steps to carry out to calculate the midrange of a set of numbers:
- Step 1: Sort out your numbers (either in ascending or descending order)
For example, if this is your set of data:
100, 30, 17, 620, 77, 900, 12, 470, 4
This will be the same set of data in ascending order:
4, 12, 17, 30, 77, 100, 470, 620, 900
This will be the same set of data in descending order:
900, 620, 470, 100, 77, 30, 17, 12, 4
- Step 2: Find the maximum and minimum numbers
This bit will be easy if you follow step 1. But first, you must look at either end of your data set and find the largest and smallest numbers.
For example, if this is your set of data in ascending order:
4, 12, 17, 30, 77, 100, 470, 620, 900
The maximum number is 900, and the minimum number is 4.
- Step 3: Use the midrange formula
There is a straightforward formula to follow when calculating the midrange. The midrange formula is:
M = (max + min) / 2
Let’s break down what this formula means:
- M = midrange
- Max = maximum value in a set of numbers
- Min = minimum value in a set of numbers
- Now, let’s apply this formula to our example:
M = (900+ 4) / 2
M = 904 / 2
M = 452
Difference Between Midrange and Range
A lot of people get confused between the midrange and the range. While they sound similar, they are different. The range is the difference between a data set’s highest and lowest numbers. However, the midrange is the average between 2 numbers in a data set.
Children will learn about these averages as part of their maths education and as part of lessons on statistics in particular.
In year 6, they’ll practice solving problems, which include finding the mean, mode, and median, while also learning about the range. Pupils will practice calculating and interpreting these averages while understanding how they’re applied in everyday life.
That’s why real-life examples play a crucial role in learning. The aim is to develop children’s mastery, but an in-depth understanding of calculating mean, mode, median, midrange, and range is needed.